Don’t forget to register for the CalcPlot3D Minicourse at the Joint Mathematics Meeting in Denver in January 2020

http://jointmathematicsmeetings.org/meetings/national/jmm2020/2245_intro

Minicourse #4. Visualizing Multivariable Calculus & Differential Equations Using CalcPlot3D, presented by Paul E. Seeburger, Monroe Community College and Monica VanDieren, Robert Morris University; Part A, Wednesday, 2:15–4:15 pm, and Part B, Friday, 1:00–3:00 pm. This course explores the use of CalcPlot3D to visualize topics in multivariable calculus and differential equations. CalcPlot3D is a versatile JavaScript web app for use on phones, tablets and computers, developed by the presenter through NSF-IUSE #1524968. Participants will use the app to visually verify problems from a variety of topics in both courses including the plane through 3 points, the intersection of two surfaces, the domain of a function of two variables, the general solution of a 1st-order differential equation, and general solutions of systems of differential equations. We will also explore a series of hands-on concept explorations designed to facilitate student understanding through exploration and visualization of a series of dynamic examples. Exploration topics include: dot product, cross product, velocity & acceleration vectors, Lagrange multiplier optimization, planes and lines in space, translations and transformations of surfaces, and TNB frames. Participants will learn to customize this app to create dynamic demonstrations and guided exploration activities of their own for student use and create files for 3D printing surfaces from the app. Participants will receive 3D glasses. Bring a laptop. See https://sites.monroecc.edu/multivariablecalculus/.

This course is sponsored by Web SIGMAA.

Posted in Uncategorized | Leave a comment

New surfaces of revolution feature is active

Under the Add to Graph drop down menu, you can now select the “Surfaces of Revolution” optio which allows you to create surfaces of revolution and show washers/shells.

Posted in Uncategorized | Leave a comment

New Link for CalcPlot3D Applet

The CalcPlot3D Applet has moved to https://c3d.libretexts.org/CalcPlot3D/index.html


Posted in Uncategorized | Leave a comment

CalcPlot3D Workshop to be held in June 2019!

We are excited to announce a 3-day workshop at Robert Morris University (Moon Township PA) from June 12-14, 2019 that will bring together a diverse collection of instructors, developers, and researchers who are currently working with CalcPlot3D or are interested in learning more about CalcPlot3D.

The workshop will expose faculty, graduate students, and high school teachers to CalcPlot3D, a dynamic visualization tool used in multivariable calculus,  differential equations, and other courses. Over the course of 3 days in a series of lectures and working sessions, participants will be involved in developing activities to share with one another and take back to their classrooms.  Additionally, participants will be invited to design and join research projects to measure the effectiveness of using CalcPlot3D as a visualization tool to improve student understanding and three-dimensional reasoning.

This workshop is for both new users of CalcPlot3D and for those who have been using it regularly in their classes already.  We plan to not only bring everyone up to speed in using CalcPlot3D effectively, but also to develop new materials, concept explorations, and classroom presentations and hands-on activities as we work together to brainstorm, develop, and share.

To find out more and to apply visit https://form.jotform.com/90566740258968

If you have any questions, please contact vandieren@rmu.edu.  Feel free to share this announcement with anyone you feel would benefit from the workshop.

Thank you,

Monica VanDieren, RMU
Paul Seeburger, Monroe Community College
Deb Moore-Russo, University of Oklahoma

Posted in Getting started, Publications and Presentations | Leave a comment

Poster presentations on CalcPlot3D at the JMM 2018 in San Diego

Monica VanDieren presents the poster Students Understanding of the Cross Product: Results from a Series of Visualization Tasks Using CalcPlot3D

Paul Seeburger demonstrating the CalcPlot3D applet to a JMM attendee.

Posted in Uncategorized | Leave a comment

Using CalcPlot3D to explore the world of quantum mechanics

By: Keir Fogarty, Ph.D.

In the early 20th century, humankind’s understanding of the world of atoms and subatomic particles underwent a revolution; we went from understanding atoms as something like teeny billiard balls to the abstract concepts of quantum mechanics. In quantum mechanics, atoms and their constituent subatomic particles (electrons, protons, neutrons) have counterintuitive properties such as wave-particle duality, probabilistic behaviors, and other features that are difficult to imagine from our perspective in the macroscopic world. As the Nobel prize winning physicist Richard Feynman famously said, “I think I can safely say that nobody understands quantum mechanics.” Despite the abstractness of quantum mechanics, scientists use their understanding of quantum mechanical properties, most notably of electrons, to design better computers, lasers, and all manner of technology that benefit us in everyday life.

feynman

Richard Feynman was not only a Nobel prize winning physicist, he was also an avid bongo player.

At this point, you might be saying to yourself, “that opening paragraph was great and all, but I am no closer to understanding what the heck quantum mechanics is.” If that is what you’re saying, you are joining practically every introductory science student learning about the properties of electrons for the first time. What is quantum mechanics? Briefly; quantum mechanics is math. Quantum mechanics is a mathematical approximation of how always moving electrons, for example, “orbit” the nucleus of an atom. This mathematical approximation very accurately mirrors the experimental results of tens of thousands of experiments that we have performed in the real world.

So what does quantum mechanics tell us about the behavior of electrons? In the theoretical world of quantum mechanics, electrons are described by four-dimensional waves of particle probability. What?! Let’s compare this to waves in the ocean. Ocean waves are three dimensional waves of water, in that they have height, width, and breadth. Now visualize ocean waves that are coming into shore; most of the ocean water found near shore is found in the peaks of the waves. In the troughs of the waves, the water is shallow—there’s less of it—but in the peaks, the water is deeper. In the oceans, waves are three-dimensional shapes affecting the surface of the ocean, which is basically two-dimensional. Electrons are what largely give atoms their volume, and as we know, volumes are three-dimensional. Thus electrons, as described by quantum mechanics, look like waves in a three-dimensional surface (the fourth dimension is probability—in other words, the probability of finding an electron at a particular position at a particular time).

Enter CalcPlot3D! If we want to learn about the quantum mechanical behavior of electrons, it really, really helps to visualize what quantum mechanics predicts electrons “look like.” As every mathematician/math student knows, waves can be described by trigonometric functions like sine and cosine. CalcPlot3D absolutely excels at graphing functions in three-dimensions, and thus is perfectly suited to visualize three-dimensional electron waves, also known as orbitals. Pictured below are electron orbitals, as plotted in CalcPlot3D. Also pictured are 3D printed electron orbital models, which have been made by taking advantage of CalcPlot3D’s .stl file export option:

orbitals

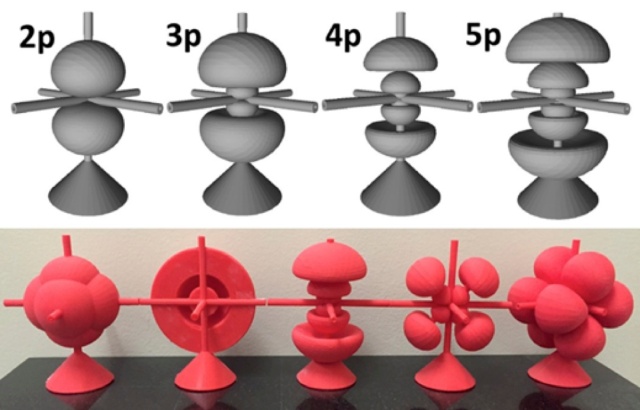
Top: orbitals created in CalcPlot3D, with their identification. The numbers refer to their energy level, and the “p” refers to their specific type.
Bottom: 3D-printed orbital models created through CalcPlot3D’s .stl file export tool. Several different types are pictured; s, p, d, & f

Pretty cool, right? Can you see how the electrons resemble three-dimensional waves? My chemistry students at High Point University made these awesome things, and you can too! If you want to learn how to, you can read the article we published in the journal of chemical education; Griffith, K. M.; de Cataldo, R.; Fogarty, K. H. “Do-It-Yourself: 3D Models of Hydrogenic Orbitals through 3D Printing.” Journal of Chemical Education 2016, 93 (9), 1586. Not only that, but if you access that article, it has all of the .stl files we generated using CalcPlot3D! You can 3D print almost 20 different models of electron-waves!

As I have said, that paper has a very detailed description of how we made the models, including step by step instructions in the supplemental portion of the article. However, it wouldn’t be fair if I didn’t talk a little about how these were made. These were made using two features in CalcPlot3D; the implicit surface tool, and the parametric surface tool. You might notice that, in addition to the “wavey” shapes of the electron orbitals, there are three cylinders, representing x, y, and z axes, as well as a cone, which serves as a base for the model. The axes cylinders and cones are created using the parametric surface tool in CalcPlot3D (actually, 4 separate parametric surface windows):

Once we have generated the axes cylinders and cone, we can generate the orbital using the implicit surface tool. Pictured below is a 2p orbital:

2p-orbital

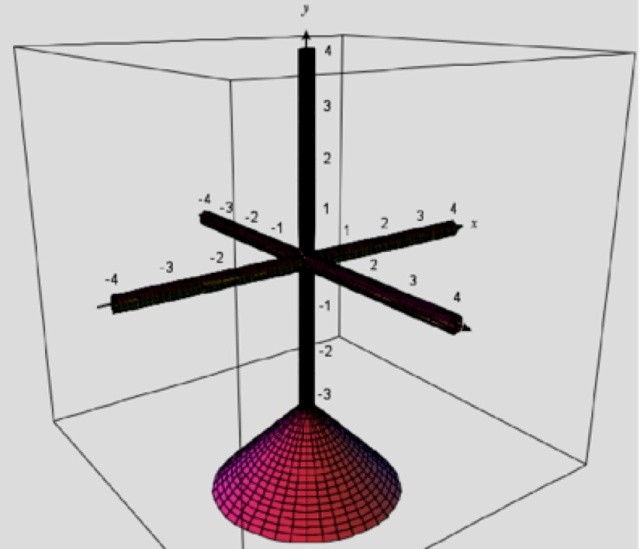
The axes cylinders and cone generated using the parametric surface tool

The 2p orbital pictured above was generated using the implicit surface tool in spherical coordinates, with adjustable parameters used to generate the shape in an appropriate scale:

2p-orbital-finish

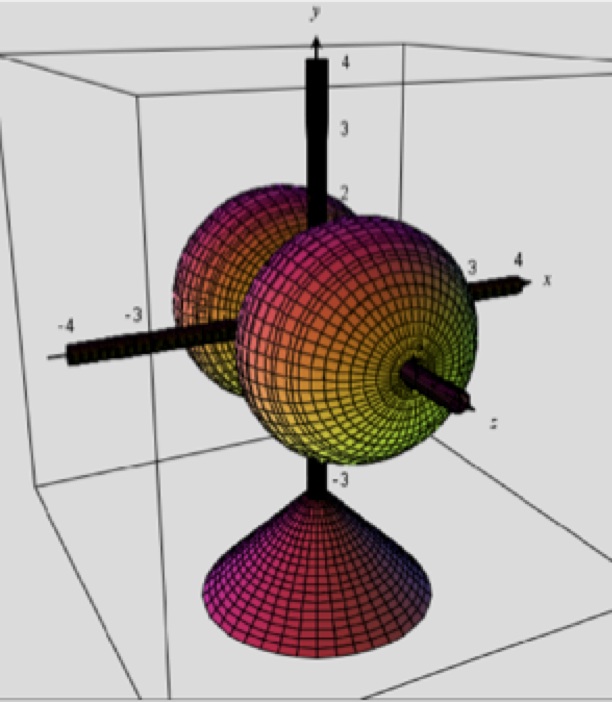
The 2p orbital generated using the implicit surface tool.

The awesome thing about CalcPlot3D is that it is so easy to generate visualization of complex mathematics in three-dimensions and then you can 3D print those awesome shapes. At High Point University, we use the CalcPlot3D models we create to help intro science students visualize the behavior of electrons in atoms.

Posted in 3D printing, Applications, Classroom Examples, Uncategorized | Leave a comment

Notes of Continued Access to the Java Applet Version of CalcPlot3D

Although I hope most of you will begin using my latest JavaScript version of CalcPlot3D most of the time, you may wish to use the Java applet version of CalcPlot3D to access some features that have not yet been included in the new JavaScript version.  You may also wish to use some of my other Java applets in your courses and/or you may wish to use Java applets from other sources to illustrate topics in your courses.  This article is posted here to help you continue to access these visualization tools.

The newest version of Firefox (starting with version 52) that released mid-March no longer supports Java applets like the Java version of CalcPlot3D and other Java applets like my 2D CalcGrapher applet (and Chrome has not supported Java applets for over a year).

Happily we do still have some options to continue to run Java applets. Java applets will still run in Internet Explorer 11, in all older versions of Firefox (version 51 and before) and in the new Extended Support Release versions of Firefox, versions 52+ (see below).

If you are having trouble now getting my Java applets to run, here are some useful links about this issue in Firefox and how to install an updated version of Firefox (Extended Support Release) that will still support Java applets until 2018 (in the 32-bit version).

Article about: https://support.mozilla.org/t5/Problems-with-add-ons-plugins-or/Why-do-Java-Silverlight-Adobe-Acrobat-and-other-plugins-no/ta-p/31069

Below are the direct links to download the correct version of Firefox (Extended Support Release) that most of you will need to continue running my Java applets. If you need other versions of Firefox for other languages or operating systems see the paragraph and link below these.

U.S. English: Windows 32-bit download: https://download.mozilla.org/?product=firefox-52.0.1esr-SSL&os=win&lang=en-US

Mac 32-bit download: https://download.mozilla.org/?product=firefox-52.0.1esr-SSL&os=osx&lang=en-US

The following link is to the download page for the Extended Support Release of the current version of Firefox. If you use this page to download it, please be careful to select the option for your system that is NOT 64-bit. That is, it needs to be the 32-bit version. Only the 32-bit version will run Java applets. You may still need to install the Java plugin again, although if it was already installed and updated on your computer, it should really already be there and require no further work (except to possibly update it, when asked).

https://www.mozilla.org/en-US/firefox/organizations/all/

After installing the ESR version of Firefox, note that you will still need to click to Activate Java on the applet page once you open the first Java applet page in this new ESR version of Firefox. You may choose to trust it permanently so you don’t need to be asked each time you run it.

Please let me know if you have any further trouble, but this ESR version of Firefox should take care of any issues for the remainder of 2017. It installs just like a normal Firefox and is the most up-to-date version in every respect.

Paul Seeburger, Project PI

Posted in Applet Updates, Uncategorized | Leave a comment

JavaScript Applet is UP!

The new JavaScript version of CalcPlot3D is now up and running.  It has many of the features of the Java version and the remaining ones are currently being developed.  This new version runs on several different browsers and even tablets and smartphones.

screenshot-applet

Because of the new format some menus options have changed locations, but many of the same shortcuts still work.  For example:

  • To toggle on/off the box, around the plot type the letter “B”
  • To toggle on/off the perspective, type the letter “P”
  • To toggle on/off transparency, type Ctrl-T
  • To reset the graph to the original orientation type the home key or
  • To view the graph from the z-axis, the x-axis, or the y-axis, type Alt-z, Alt-x, or Alt- y, respectively).
  • To save the current view as a URL to access later, click on the triple bars, then File, then Encode View in URL.
  • The 2D-trace plane that allows you to move a point along the surface is hidden in the default mode.  To view the trace plane, select the grid icon that contains a blue point.
  • To view the built-in examples of space curves, vector fields, surfaces, etc., click on the triple bars, then examples.
  • The parameters (a,b,c,d) can be controlled and added by selecting the “Slider” option under “add to graph.”


Posted in Applet Updates, Uncategorized | Leave a comment

A sweet application of parametric curves

This Washington Post article about the mathematics of taffy pulling is screaming to be turned into a classroom example/activity.  And here’s a link to the full mathematical article in the arxiv complete with equations.

Posted in Uncategorized | Leave a comment

CalcPlot3D workshop at RMU

calcplot3d-workshop

On August 7-10, 2016, nine engineers, mathematicians, developers, and educators met at Robert Morris University to develop new CalcPlot3D explorations, to begin importation of explorations to WeBWorK, and to continue research on student understanding of multivariable calculus concepts.  The new explorations will be described on the blog after they are pilot tested and are ready for dissemination.

Posted in Uncategorized | Leave a comment